Making high-dimensional ideas legible
A lot of my work is taking an abstract, high-dimensional result and turning it into a picture the right audience can actually read — a pattern you can see instead of a table of numbers you have to decode. Every figure below is my own, built in Julia with Makie.
The whole pipeline in one figure
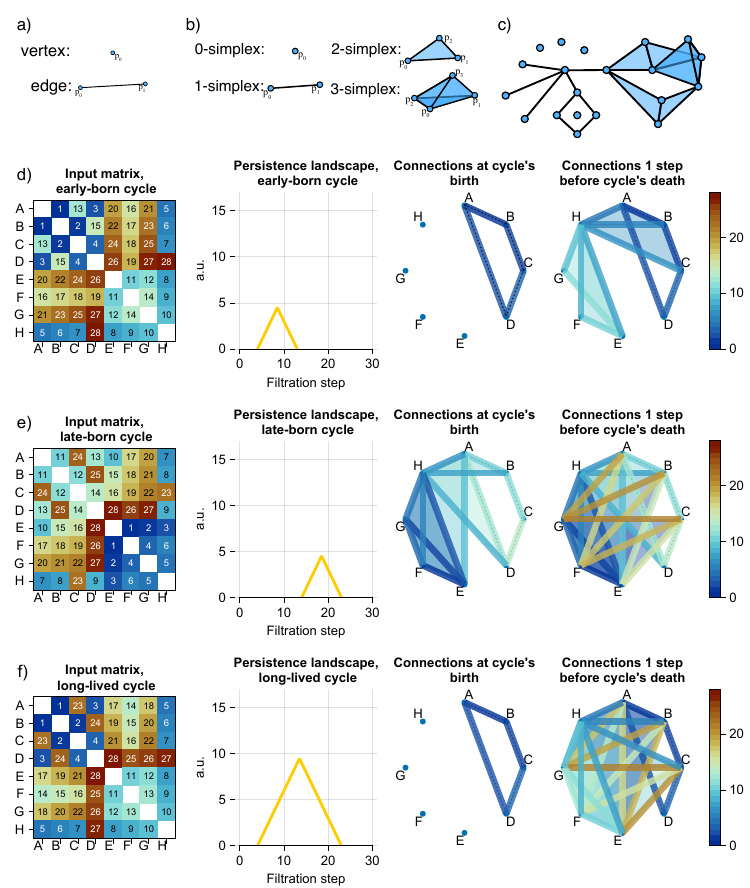
This is the figure for a reviewer: raw connectivity matrix → weighted clique filtration → persistence landscape → the specific network cycles that drive the signal, coloured by when they appear. It packs a full analysis into one readable path — every panel answers a question an expert would ask.
Making comparison visual
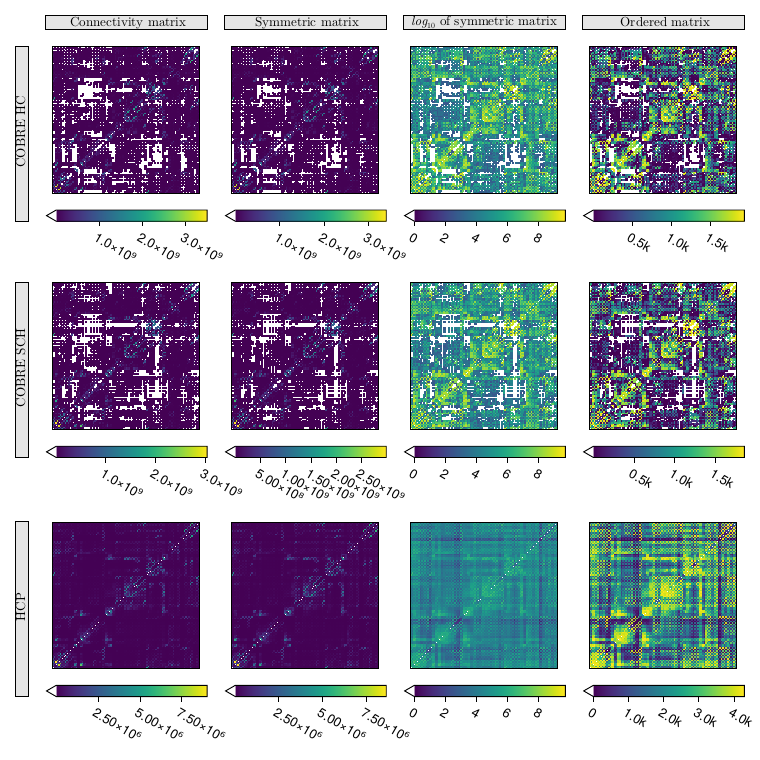
Comparing whole cohorts at a glance. Connectivity structure for several groups side by side, so differences that are invisible in a table of numbers become obvious as pattern.
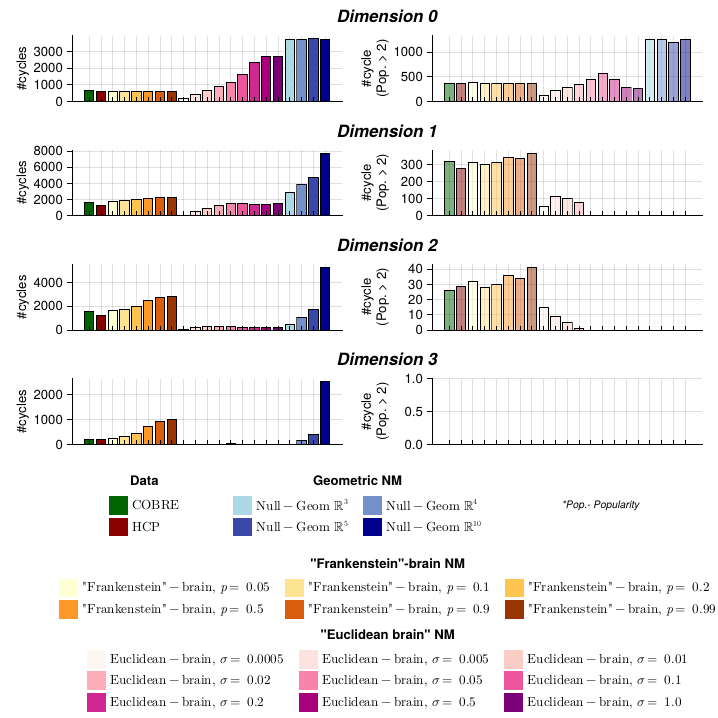
Which structures are real, not noise. How often each topological cycle recurs across subjects, compared against carefully matched null models — the evidence that a pattern is genuine rather than an artefact.
These figures come from my published and in-preparation work on the topology of perception and network structure, built in Julia with Makie.